LinkedIn Analytics Advisor
LinkedIn Analytics — describe honestly, then refuse to over-conclude
Use when someone wants to understand their own LinkedIn numbers — which posts worked, why reach dropped, whether a pattern is real, or how to test a hypothesis. Triggers on "why did my reach drop", "what's working on my LinkedIn",…
---
name: linkedin-analytics
description: Use when someone wants to understand their own LinkedIn numbers — which posts worked, why reach dropped, whether a pattern is real, or how to test a hypothesis. Triggers on "why did my reach drop", "what's working on my LinkedIn", "analyze my posts", "do carousels do better for me", "should I test this", "LinkedIn analytics". Reads your own exported post data, reports medians and outlier bands, tests candidate patterns against a permutation null, and sizes a real experiment — refusing to conclude anything below 10 posts.
license: MIT
metadata:
  version: 1.0.0
  author: Alireza Rezvani
  category: marketing
  updated: 2026-08-25
---

# LinkedIn Analytics — describe honestly, then refuse to over-conclude

The characteristic sentence of LinkedIn analytics is "carousels do 3x better for me", built
on four posts. With engagement as heavy-tailed as it is, four posts will show a 3x difference
between almost any two groups you care to define. These three scripts stop that sentence
becoming a strategy.
Overview
The characteristic sentence of LinkedIn analytics is "carousels do 3x better for me", built on four posts. With engagement as heavy-tailed as it is, four posts will show a 3x difference between almost any two groups you care to define. These three scripts stop that sentence becoming a strategy.
Manual install (npx, ZIP)
npx skills add alirezarezvani/claude-skills --skill linkedin-analytics -g -a claude-codenpx degit alirezarezvani/claude-skills/marketing/linkedin/skills/linkedin-analytics#main ~/.claude/skills/linkedin-analyticsConnects with Agent Alley MCP · agentalley.io/mcp
Files included
SKILL.md5.2 KB
Read SKILL.md here
Show the full text101 lines
LinkedIn Analytics — describe honestly, then refuse to over-conclude
The characteristic sentence of LinkedIn analytics is "carousels do 3x better for me", built on four posts. With engagement as heavy-tailed as it is, four posts will show a 3x difference between almost any two groups you care to define. These three scripts stop that sentence becoming a strategy.
Your own data only. Nothing is fetched; scraping post or profile data is prohibited by User Agreement §8.2 and none of this analysis needs it.
Workflow
1. Get the export. LinkedIn Analytics → Post impressions → Export, or Settings → Data privacy → Get a copy of your data. CSV and JSON both work.
2. Describe it. Exit 0 analysed / 2 below the 10-post floor, descriptive only / 3 unusable. Reports median and MAD rather than mean and standard deviation — one breakout post makes a mean describe a distribution none of your posts belong to — plus Tukey percentile bands and a 1.5×IQR breakout threshold, so "this did well" has a number behind it.
python3 scripts/post_performance_analyzer.py --input posts.csv --csv --output human
3. Test the pattern they think they see.
python3 scripts/pattern_miner.py --input posts.json --output human
Exit 0 something survived / 2 nothing survived / 3 under 10 posts. Four gates: 5 posts in and 5 out; a 15% relative difference in medians; beating 90% of 2,000 seeded label shuffles; and a multiple-comparisons accounting of how many candidates would pass on noise alone.
"Nothing survived" is the most common honest answer and it is a real finding. Report it as one. Do not soften it into a hedge that reads like a conclusion.
4. Turn a survivor into a test.
python3 scripts/experiment_planner.py --hypothesis "..." --variable "..." \
  --cv 0.45 --effect 0.30 --posts-per-week 2 --max-weeks 12 --output human
CV comes from step 2: 1.4826 * MAD / median. Exit 0 feasible / 2 too long, with the minimum
detectable effect in their window / 3 refused. It will frequently say the test needs more
posts than a quarter allows — that is the honest answer, and more useful than a confident
conclusion from retrospective data.
Rules
- Under 10 posts, describe; do not conclude. Say so plainly.
- A pattern in past posts is a hypothesis. Retrospective data is confounded — you made carousels when you had structured material, on topics you knew best, in weeks you had time. No statistics on the same data removes that.
- Never benchmark against someone else's numbers. Different denominator, different audience, usually a vendor's sample.
- Follower count is not a success metric. Track inbound conversations, specific references, invitations — the Tier 1 metrics you count by hand.
- Report the confidence level. LinkedIn-official 🟢, third-party study 🟡, folklore 🔴.
- One good post is not evidence. It is the most common cause of a strategy change and the least informative event available.
Scripts
| Script | Role |
|---|---|
scripts/post_performance_analyzer.py |
Median/MAD, percentile bands, IQR outlier fence, per-post BREAKOUT→DUD classification; refuses conclusions below 10 posts. |
scripts/pattern_miner.py |
Four-gate permutation test with multiple-comparisons accounting; reports why every rejected candidate failed. |
scripts/experiment_planner.py |
Sizes a two-arm posting experiment, names the confounds to hold constant, and writes the falsification condition before the first post. |
References and assets
references/linkedin_metrics_canon.md— what each number is, what it is not, and which three tiers to track (7 sources)references/evidence_thresholds.md— the four gates, forking paths, and the uncomfortable arithmetic of LinkedIn A/B tests (7 sources)assets/example_post_export.csv— a 12-post export in the expected shapeassets/measurement_log_template.md— the Tier 1 outcome log you keep by hand
Distinct from
marketing-skill/social-media-analyzer— cross-platform brand campaign reporting. This is one person's own LinkedIn export, with refusals attached.linkedin-strategy— decides what to do next. This says what happened.product-team/experiment-designer— product A/B tests with real traffic; here n is posts, and usually too small.
Version: 1.0.0
| 1 | |
| 2 | name linkedin-analytics |
| 3 | description Use when someone wants to understand their own LinkedIn numbers — which posts worked, why reach dropped, whether a pattern is real, or how to test a hypothesis. Triggers on "why did my reach drop", "what's working on my LinkedIn", "analyze my posts", "do carousels do better for me", "should I test this", "LinkedIn analytics". Reads your own exported post data, reports medians and outlier bands, tests candidate patterns against a permutation null, and sizes a real experiment — refusing to conclude anything below 10 posts. |
| 4 | license MIT |
| 5 | metadata |
| 6 | version 1.0.0 |
| 7 | author Alireza Rezvani |
| 8 | category marketing |
| 9 | updated 2026-08-25 |
| 10 | |
| 11 | |
| 12 | # LinkedIn Analytics — describe honestly, then refuse to over-conclude |
| 13 | |
| 14 | The characteristic sentence of LinkedIn analytics is "carousels do 3x better for me", built |
| 15 | on four posts. With engagement as heavy-tailed as it is, four posts will show a 3x difference |
| 16 | between almost any two groups you care to define. These three scripts stop that sentence |
| 17 | becoming a strategy. |
| 18 | |
| 19 | **Your own data only.** Nothing is fetched; scraping post or profile data is prohibited by |
| 20 | User Agreement §8.2 and none of this analysis needs it. |
| 21 | |
| 22 | ## Workflow |
| 23 | |
| 24 | **1. Get the export.** LinkedIn Analytics → Post impressions → Export, or Settings → Data |
| 25 | privacy → Get a copy of your data. CSV and JSON both work. |
| 26 | |
| 27 | **2. Describe it.** Exit 0 analysed / 2 below the 10-post floor, descriptive only / 3 |
| 28 | unusable. Reports median and MAD rather than mean and standard deviation — one breakout post |
| 29 | makes a mean describe a distribution none of your posts belong to — plus Tukey percentile |
| 30 | bands and a 1.5×IQR breakout threshold, so "this did well" has a number behind it. |
| 31 | |
| 32 | |
| 33 | python3 scripts/post_performance_analyzer.py --input posts.csv --csv --output human |
| 34 | |
| 35 | |
| 36 | **3. Test the pattern they think they see.** |
| 37 | |
| 38 | |
| 39 | python3 scripts/pattern_miner.py --input posts.json --output human |
| 40 | |
| 41 | |
| 42 | Exit 0 something survived / 2 nothing survived / 3 under 10 posts. Four gates: 5 posts in and |
| 43 | 5 out; a 15% relative difference in medians; beating 90% of 2,000 seeded label shuffles; and |
| 44 | a multiple-comparisons accounting of how many candidates would pass on noise alone. |
| 45 | |
| 46 | **"Nothing survived" is the most common honest answer and it is a real finding.** Report it |
| 47 | as one. Do not soften it into a hedge that reads like a conclusion. |
| 48 | |
| 49 | **4. Turn a survivor into a test.** |
| 50 | |
| 51 | |
| 52 | python3 scripts/experiment_planner.py --hypothesis "..." --variable "..." \ |
| 53 | --cv 0.45 --effect 0.30 --posts-per-week 2 --max-weeks 12 --output human |
| 54 | |
| 55 | |
| 56 | CV comes from step 2: `1.4826 * MAD / median`. Exit 0 feasible / 2 too long, with the minimum |
| 57 | detectable effect in their window / 3 refused. It will frequently say the test needs more |
| 58 | posts than a quarter allows — **that is the honest answer**, and more useful than a confident |
| 59 | conclusion from retrospective data. |
| 60 | |
| 61 | ## Rules |
| 62 | |
| 63 | **Under 10 posts, describe; do not conclude.** Say so plainly. |
| 64 | **A pattern in past posts is a hypothesis.** Retrospective data is confounded — you made |
| 65 | carousels when you had structured material, on topics you knew best, in weeks you had time. |
| 66 | No statistics on the same data removes that. |
| 67 | **Never benchmark against someone else's numbers.** Different denominator, different |
| 68 | audience, usually a vendor's sample. |
| 69 | **Follower count is not a success metric.** Track inbound conversations, specific |
| 70 | references, invitations — the Tier 1 metrics you count by hand. |
| 71 | **Report the confidence level.** LinkedIn-official 🟢, third-party study 🟡, folklore 🔴. |
| 72 | **One good post is not evidence.** It is the most common cause of a strategy change and the |
| 73 | least informative event available. |
| 74 | |
| 75 | ## Scripts |
| 76 | |
| 77 | | Script | Role | |
| 78 | |---|---| |
| 79 | | [`scripts/post_performance_analyzer.py`] | Median/MAD, percentile bands, IQR outlier fence, per-post BREAKOUT→DUD classification; refuses conclusions below 10 posts. | |
| 80 | | [`scripts/pattern_miner.py`] | Four-gate permutation test with multiple-comparisons accounting; reports why every rejected candidate failed. | |
| 81 | | [`scripts/experiment_planner.py`] | Sizes a two-arm posting experiment, names the confounds to hold constant, and writes the falsification condition before the first post. | |
| 82 | |
| 83 | ## References and assets |
| 84 | |
| 85 | [`references/linkedin_metrics_canon.md`] — what each number is, what it is not, and which three tiers to track (7 sources) |
| 86 | [`references/evidence_thresholds.md`] — the four gates, forking paths, and the uncomfortable arithmetic of LinkedIn A/B tests (7 sources) |
| 87 | |
| 88 | [`assets/example_post_export.csv`] — a 12-post export in the expected shape |
| 89 | [`assets/measurement_log_template.md`] — the Tier 1 outcome log you keep by hand |
| 90 | |
| 91 | ## Distinct from |
| 92 | |
| 93 | **`marketing-skill/social-media-analyzer`** — cross-platform brand campaign reporting. This |
| 94 | is one person's own LinkedIn export, with refusals attached. |
| 95 | **`linkedin-strategy`** — decides what to do next. This says what happened. |
| 96 | **`product-team/experiment-designer`** — product A/B tests with real traffic; here n is |
| 97 | posts, and usually too small. |
| 98 | |
| 99 | |
| 100 | **Version:** 1.0.0 |
| 101 |
Details
- Updated
- Aug 30, 2026
- License
- MIT
- Stars on the repo
- ★ 26,349
- Checked
- Source
- alirezarezvani/claude-skills ↗
- Creator
- alirezarezvani · 363 listings
Similar skills
See all →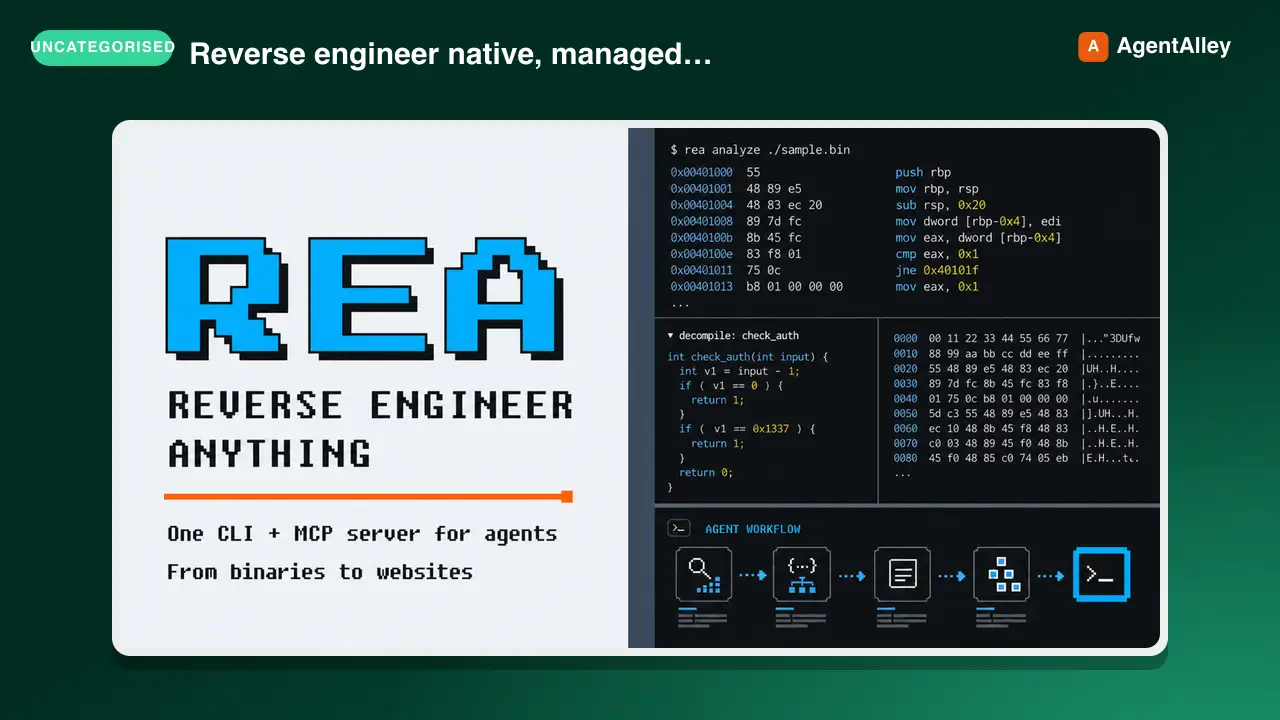 SkillCross-Platform Reverse Engineer
 morluto/rea · by morlutoReverse engineer native, managed, Electron/JavaScript, packaged, firmware, and browser targets with REA. Use shipped-artifact or requested runtime evidence to explain features, compare versions, decompile code, or guide a reconstruction. Skip REA for ordinary source-repository architecture analysis.★ 316k GitHub stars
 SkillBrainstorm Ideas
 obra/superpowers · by obraYou MUST use this before any creative work - creating features, building components, adding functionality, or modifying behavior. Explores user intent, requirements and design before implementation.★ 290k GitHub stars
 SkillCode Review Feedback Analyzerobra/superpowers · by obraUse when receiving code review feedback, before implementing suggestions, especially if feedback seems unclear or technically questionable - requires technical rigor and verification, not performative agreement or blind implementation★ 290k GitHub stars
 SkillBug Diagnosis Framework
 mattpocock/skills · by mattpocockDiagnosis loop for hard bugs and performance regressions. Use when the user says "diagnose"/"debug this", or reports something broken/throwing/failing/slow.★ 267k GitHub stars
 SkillImplement Specmattpocock/skills · by mattpocockImplement the result of /to-spec and /to-tickets in code.★ 267k GitHub stars
 SkillPR Description Writermattpocock/skills · by mattpocockUse when writing a PR body.★ 267k GitHub stars
More from alirezarezvani
 SkillExperiment Resume Tool
 alirezarezvani/claude-skills · by alirezarezvaniResume a paused experiment. Checkout the experiment branch, read results history, continue iterating. Use when the user runs /ar:ar-resume or asks to pick up a previously started autoresearch experiment.★ 26.3k GitHub stars
 SkillExperiment Dashboard Vieweralirezarezvani/claude-skills · by alirezarezvaniShow experiment dashboard with results, active loops, and progress. Use when the user runs /ar:ar-status or asks how an autoresearch experiment is going.★ 26.3k GitHub stars
 SkillAutonomous Experiment Runneralirezarezvani/claude-skills · by alirezarezvaniStart an autonomous experiment loop with user-selected interval (10min, 1h, daily, weekly, monthly). Uses CronCreate for scheduling. Use when the user runs /ar:loop or asks to run an autoresearch experiment continuously on a schedule.★ 26.3k GitHub stars
 SkillSingle Experiment Iteratoralirezarezvani/claude-skills · by alirezarezvaniRun a single experiment iteration. Edit the target file, evaluate, keep or discard. Use when the user runs /ar:run or asks for one manual autoresearch iteration.★ 26.3k GitHub stars
 SkillAutoresearch Experiment Setupalirezarezvani/claude-skills · by alirezarezvaniSet up a new autoresearch experiment interactively. Collects domain, target file, eval command, metric, direction, and evaluator. Use when the user runs /ar:setup or asks to start optimizing a file with the autoresearch loop.★ 26.3k GitHub stars
 SkillExecutive Boardroom Deliberatoralirezarezvani/claude-skills · by alirezarezvani/cs:boardroom <brief> — 6-phase multi-role deliberation across the C-suite with Phase 2 isolation, critic pre-screen, and synthesis. Outputs a board memo. Use when a decision spans multiple executive domains — e.g. a pricing change touching finance, positioning, and product, or a raise-vs-cut runway call.★ 26.3k GitHub stars